Eight Bit Gauges in Jupyter
April 27, 2020
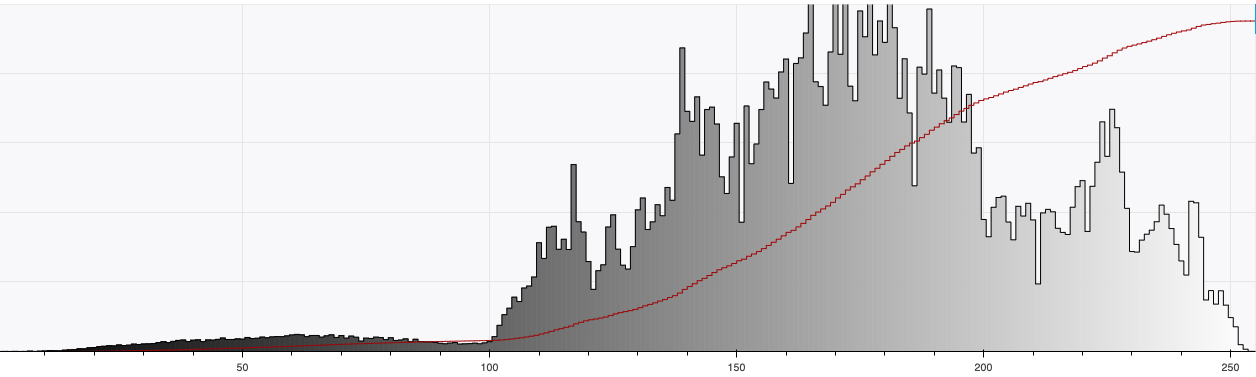
Over the last few weeks I have written so many variants on “eight bit gauges” in Jupyter that I thought I might as well corral them all together in a menagerie. By eight big gauges I mean histograms with 256 bins.
For example, the above image is for grayscale images as implied by the gray gradient on the face of the histogram. The red line is the same data but as a cumulative distribution, starting at zero and marching monotonically to 100% total luminance.
 The code is all Python using common plotting libraries (Bokeh, Plotly,
Matplotlib, etc.). In particular, the code has been well tested on
Colab, including working out full-screenable versions which perform well
as “slides.” I’ve licensed the code under the Apache 2 license. So, peruse
the menagerie and maybe take one home.
The code is all Python using common plotting libraries (Bokeh, Plotly,
Matplotlib, etc.). In particular, the code has been well tested on
Colab, including working out full-screenable versions which perform well
as “slides.” I’ve licensed the code under the Apache 2 license. So, peruse
the menagerie and maybe take one home.

There is a pre-run and runnable copy on Colab, eight_bit_gauges.ipynb, which can also be found on GitHub in the shell repo. To load it from from GitHub and run your own copy: